Unlocking the feasibility of rare disease drug development
Insights from quantitative systems modeling
Oct 2, 2025 | Report
Executive summary
Unlocking the feasibility of rare disease drug development
Millions of people are affected by rare diseases worldwide, yet fewer than 10% have approved treatments. This is largely because the high cost of drug development makes developing medicines infeasible for diseases with small patient populations. In this paper we share how developing medicines for rare diseases can be more feasible through genotype-first patient finding approaches, pursuing genetically validated targets, policy incentives and lowering the cost of capital. Our modeling identifies a critical threshold, the "frontier of feasibility," representing the minimum patient population size at which developing a rare disease therapy becomes economically viable.
Unlocking the feasibility of rare disease drug development
Key levers: Genotype-first patient finding approaches can potentially address underdiagnosis and boost a program value by ~4.5x in certain examples; pursuing genetically validated targets increases the probability of success more than 2x and expands the frontier of feasibility by 35%; extending market exclusivity by 2 years through the Orphan Drug Act expanded the frontier of feasibility by 26%; and lowering cost of capital from 13% to 8% can expand the frontier by ~32%. Together, these shifts lower the bar for what makes a rare-disease medicine commercially viable, opening the door to develop cures for many smaller patient groups that would otherwise be out of reach.
Impact: Unlocks >500 underserved diseases, benefiting >14 million U.S. patients. This simulation framework empowers drug developers and policymakers to strategically investigate factors impacting rare disease drug development, enabling data-driven approaches to expand the frontier of feasibility and accelerate therapies for unmet needs.
The challenge: economic barriers in rare disease drug development
There are collectively more than 10,000 rare diseases impacting millions globally, defined in the U.S. as diseases affecting fewer than 200,000 individuals. The introduction of the 1983 Orphan Drug Act significantly increased the number of available treatments for rare diseases, but attention has been mainly focused on the highest-prevalence diseases resulting in a highly skewed distribution of development where most of the focus are on a handful of orphan indications.
Orphan Drug Development by Indication & Stage
Stacked bars show the distribution of non-oncology development programs across different stages for each indication. Hover over bars to see detailed breakdowns.
- Herding effect: the top five non-oncology orphan indications have combined >180 active drugs; the median across all non-oncology orphan indications is two per indication.
- Underserved ultra-rare: Of diseases with prevalence less than 1 in 1,000,000, <10% have active drug development programs, whereas >50% of those with a prevalence of 1–5 per 10,000 have approvals.
- Core issue: rare diseases with small cohorts struggle to attract investments required to make developing medicines economically feasible.
Frontier of feasibility
When evaluating the potential of rare disease drug development programs, there's a tipping point where developing a therapy becomes economically viable. In a setting where development assumptions are fixed this represents the minimum number of patients needed for a treatment program to cover its development cost when factoring in costs, timelines, and the odds of success. We refer to this threshold as the frontier of feasibility. Beyond this line, programs typically struggle to attract the necessary investment despite high medical need. In our approach, we measure economic feasibility using a risk-adjusted net present value (rNPV) model.
Moving the frontier even slightly can open the door to developing medicines for hundreds of rare diseases, potentially reaching millions of patients who have no treatment options today.
Pushing the frontier of feasibility
Every minute counts for patients: effect of cost of capital and risk adjustment
Biotech companies need capital to advance medicines through pre-clinical and clinical trials and they typically do so without recognizing any revenue over that period of time, often lasting more than 8 years.
By the time the new treatment enters the market, for every $1M spent in the pre-clinical stages a minimum of $2.5M of revenue is required to offset the costs to make this a positive investment due to the annual cost of capital. However, this doesn't account for the risk taken at each development stage. When risk is taken into account, this number jumps to a need of at least $17.9M of revenue per $1M spent in early development.
For this reason, it is important to select programs with a high probability of success, be strategic on early spend by selecting the right experiments to generate critical insights early, and make sure every minute counts to accelerate the development process and ensure treatments reach patients as fast as possible.
Present value of $1M
Analysis of how discount rates and development stage risks compound to affect present value calculations, using an annual discount rate of 13% to demonstrate the financial impact on rare disease drug development programs.
Navigating uncertainty: how risk-adjusted NPV guides our strategic decisions
Drug development is a risky, capital-intensive, multi-year endeavor costing an average of~$332M over ~10-15 years. It requires careful estimation of investments across research, clinical trials, and regulatory approvals, along with projected revenue from market sales. Our internal valuations are based on Net Present Value (NPV) which is rooted in the time value of money, as illustrated in the previous section.
In this framework, all projected future cashflows for a drug development program are adjusted to their present-day value using an annual cost of capital value, also referred to as discount rate, to evaluate whether a program is financially viable. Risk-adjusted NPV (rNPV) builds on this by factoring in the probability of success at each stage. This is critical for high-risk fields like rare disease therapeutics where only ~14% of programs succeed.
Trial Success Rates and rNPV Calculations
Comprehensive analysis of clinical trial success rates across development phases and their impact on risk-adjusted net present value calculations for rare disease drug development programs.
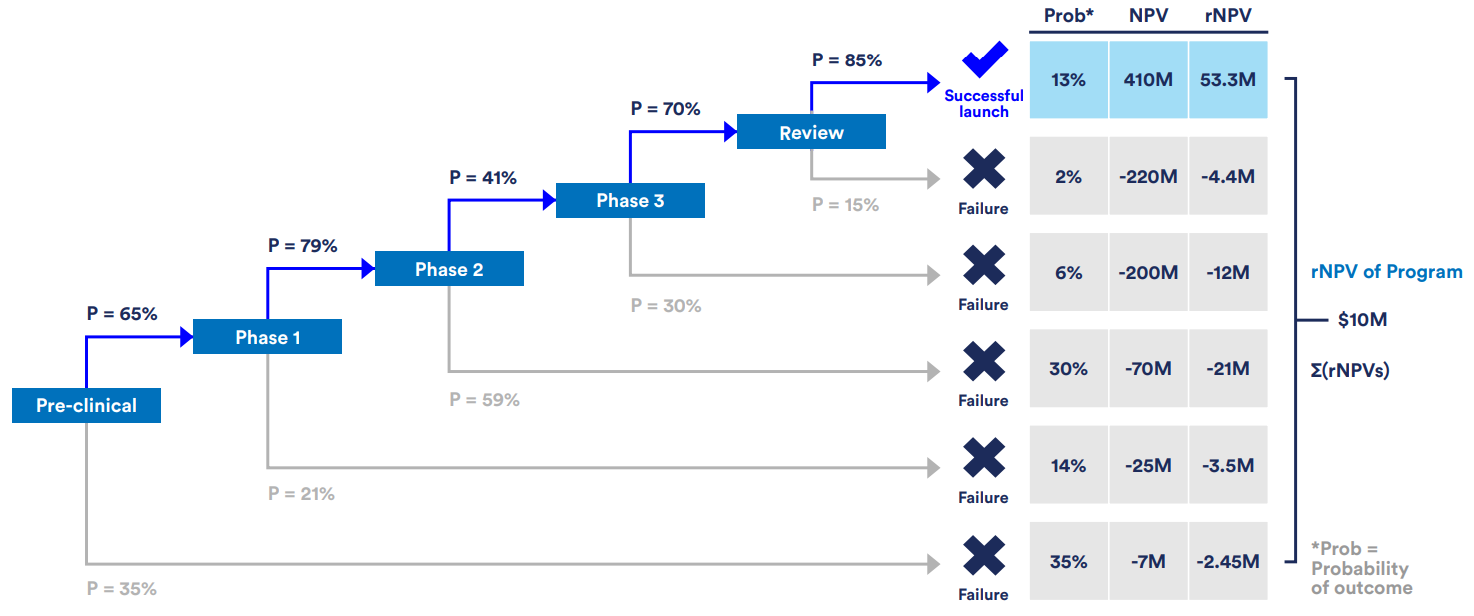
Evaluating potential development programs through risk-adjusted net present value (rNPV) and quantifying the impact of specific assumptions helps reveal opportunities that can lead to lifechanging treatments for underserved patients.
Key levers that lower economic barriers include:
- • More accurate prevalence estimates from population-scale genetic data.
- • Higher clinical success rates by prioritizing genetically validated targets.
- • Regulatory incentives such as extended market exclusivity and the Priority Review Voucher (PRV) program.
- • Lower cost of capital achieved through portfolio risk reduction.
Because these levers can interact and build on one another, it is important to systematically assess their impact to understand how their individual and combined impact on program value.
Methodology: a simulation framework for strategic investigation of feasibility factors
We developed a scenario-based systems modeling framework that simulates cash flows across the drug development stages, from preclinical work through post-launch market performance, and computes the rNPV for a given program. The framework allows us to vary assumptions and test scenarios to quantify how specific interventions affect overall rNPV, such as improved prevalence estimation, genetic target validation, regulatory incentives, and reduced cost of capital. These insights help identify combinations of levers that can attract investment to overlooked rare diseases and accelerate delivery of medicines to underserved patients.
Model inputs:
- Development costs: $7.3M–$235.9M per stage across preclinical through Phase 3
- Stage durations: ~1–3 years per phase
- Success probabilities: ~40%–80% by stage
- Market assumptions: Market uptake curve (5-year time-to-peak), market exclusivity period, post-patent decay
- Financial parameters: 13% discount rate, set annual treatment price, 21% tax rate
Model outputs:
- Risk-adjusted NPV (rNPV)
- Time-phased cash flows incorporating development costs and market revenues
- Probability weighted outcome scenarios
- Frontier of feasibility
Patient Population Size versus rNPV
rNPV values using the default model assumptions for drug development were calculated for a range of hypothetical patient cohorts. The frontier of feasibility is defined as the number of patients on a drug that results in a neutral rNPV. An annual discount rate of 13% was used to calculate the rNPV value. Under these specific set of assumptions, the frontier of feasibility sits at 2,772 patients.
Levers that expand feasibility
Re-sizing the patient pool with genomics can make many more rare diseases economically viable
Picking targets with human-genetic evidence doubles success odds
Policy incentives: extending exclusivity and adding runway
Cost of capital: lower the cost of capital by building a safer portfolio
Putting the levers together
In our default model, combining all levers shifts the frontier of feasibility from ~2,772 patients to just ~1,600 patients. This potentially impacts more than 500 diseases, affecting ~14M people in the U.S. alone.
Portfolio Optimization Across Discount Rates
Impact of various development strategies on the number of patients needed to achieve neutral rNPV across different discount rates, demonstrating the value of genetic support and PRV sales in portfolio optimization.
Guidance for drug developers
Tackle underdiagnosis with genomics resources. Use large genetic databases to understand how many people may be affected, then compare this to current diagnoses to reveal patients who remain undiagnosed and could benefit from improved testing and awareness.
Focus on targets with genetic support. Put human genetics at the top of the target selection checklist. The evidence implies a ~35% expansion of the feasibility frontier and ~2.25X steeper value growth.
Utilize strategies to lower the cost of capital. Diversify with independent shots on goal, use structured or portfolio financing, and derisk to secure a lower discount rate. A 5% drop in the discount rate translates to a ~32% expansion of the frontier of feasibility.
Early savings compound dramatically. Savings earlier in development have more impact on value than the same savings later. Prioritize experiments and tests with high predictive validity especially during early development.
Guidance for policymakers and payers
Keep and calibrate orphan exclusivity. The model shows clear gains from 5 to 7 years under the current policy; further extension of market exclusivity would contribute even more to expanding the frontier of feasibility.
Renew the priority review voucher program. A PRV sale meaningfully improves feasibility for small indications and channels funds from large-market drugs to rare pediatric programs.
Invest in data that helps find patients. Fund and open access to biobanks and linked health records and modern diagnostics. Genetics-first counts can multiply apparent prevalence and directly change feasibility.
Interactive Risk-Adjusted Cashflow Model
for Drug Development Feasibility
Advanced NPV model with quarterly cost timing, logistic market uptake, and exponential post-LOE decay. Explore how different parameters impact drug development feasibility.
Interested in potential collaboration or using the full framework? Email inquiries to [email protected]
Model Parameters
Patient Population Analysis
Financial Parameters
Stage Success Probabilities
Market Parameters
Outcome possibilities
Model Features
Advanced Modeling
- Quarterly Cost Timing: More accurate NPV with costs at end of each quarter
- Logistic Market Uptake: Realistic S-curve adoption pattern
- Exponential Decay: Post-LOE revenue erosion with configurable half-life
- Tax-Adjusted Returns: After-tax cashflows with COGS and SG&A
Market Dynamics
- Market Dynamics: Logistic uptake curve with configurable time to peak
- Post-LOE Erosion: Exponential decay with adjustable half-life
- Tail Revenue: Configurable post-exclusivity revenue tail
- Outcome Distribution: Full probability distribution of NPV outcomes
References
References
- 1. Minikel, E. V., Painter, J. L., Dong, C. C. & Nelson, M. R. Refining the impact of genetic evidence on clinical success. Nature 629, 624–629 (2024).
- 2. Nelson, M. R. et al. The support of human genetic evidence for approved drug indications. Nat. Genet. 47, 856–860 (2015).
- 3. Narayan, S. K., Gorman, G., Kalaria, R. N., Ford, G. A. & Chinnery, P. F. The minimum prevalence of CADASIL in northeast England. Neurology 78, 1025–1027 (2012).
- 4. Cho, B. P. H. et al. Association of Vascular Risk Factors and Genetic Factors With Penetrance of Variants Causing Monogenic Stroke. JAMA Neurol. 79, 1303 (2022).
- 5. Chang, J. B. et al. A calcium-sensing receptor allelic series and underdiagnosis of genetically driven hypocalcemia. Am. J. Hum. Genet. 112, 1818–1832 (2025).
- 6. Haendel, M. et al. How many rare diseases are there? Nat. Rev. Drug Discov. 19, 77–78 (2020).
- 7. Lamoreaux, K., Lefebvre, S., Levine, D., Erler, W. & Hume, T. The Power of Being Counted. (2022).
- 8. Fougner, C., Cannon, J., The, L., Smith, J. F. & Leclerc, O. Herding in the drug development pipeline. Nat. Rev. Drug Discov. 22, 617–618 (2023).
- 9. Fagnan, D. E., Gromatzky, A. A., Stein, R. M., Fernandez, J.-M. & Lo, A. W. Financing drug discovery for orphan diseases. Drug Discov. Today 19, 533–538 (2014).
- 10. Scannell, J. W. et al. Predictive validity in drug discovery: what it is, why it matters and how to improve it. Nat. Rev. Drug Discov. 21, 915–931 (2022).
- 11. Kumar, N., Lo, A. W., Shukla, C. & Stephenson, B. Applications of Portfolio Theory to Accelerating Biomedical Innovation. J. Portf. Manag. 51, 213–236 (2024).
- 12. DiMasi, J. A., Grabowski, H. G. & Hansen, R. W. Innovation in the pharmaceutical industry: New estimates of R&D costs. J. Health Econ. 47, 20–33 (2016).
- 13. Wouters, O. J., McKee, M. & Luyten, J. Estimated Research and Development Investment Needed to Bring a New Medicine to Market, 2009-2018. JAMA 323, 844 (2020).
- 14. Paul, S. M. et al. How to improve R&D productivity: the pharmaceutical industry's grand challenge. Nat. Rev. Drug Discov. 9, 203–214 (2010).
- 15. Baras, A. I., Baras, A. S. & Schulman, K. A. Drug development risk and the cost of capital. Nat. Rev. Drug Discov. 11, 347–348 (2012).